Award-winning
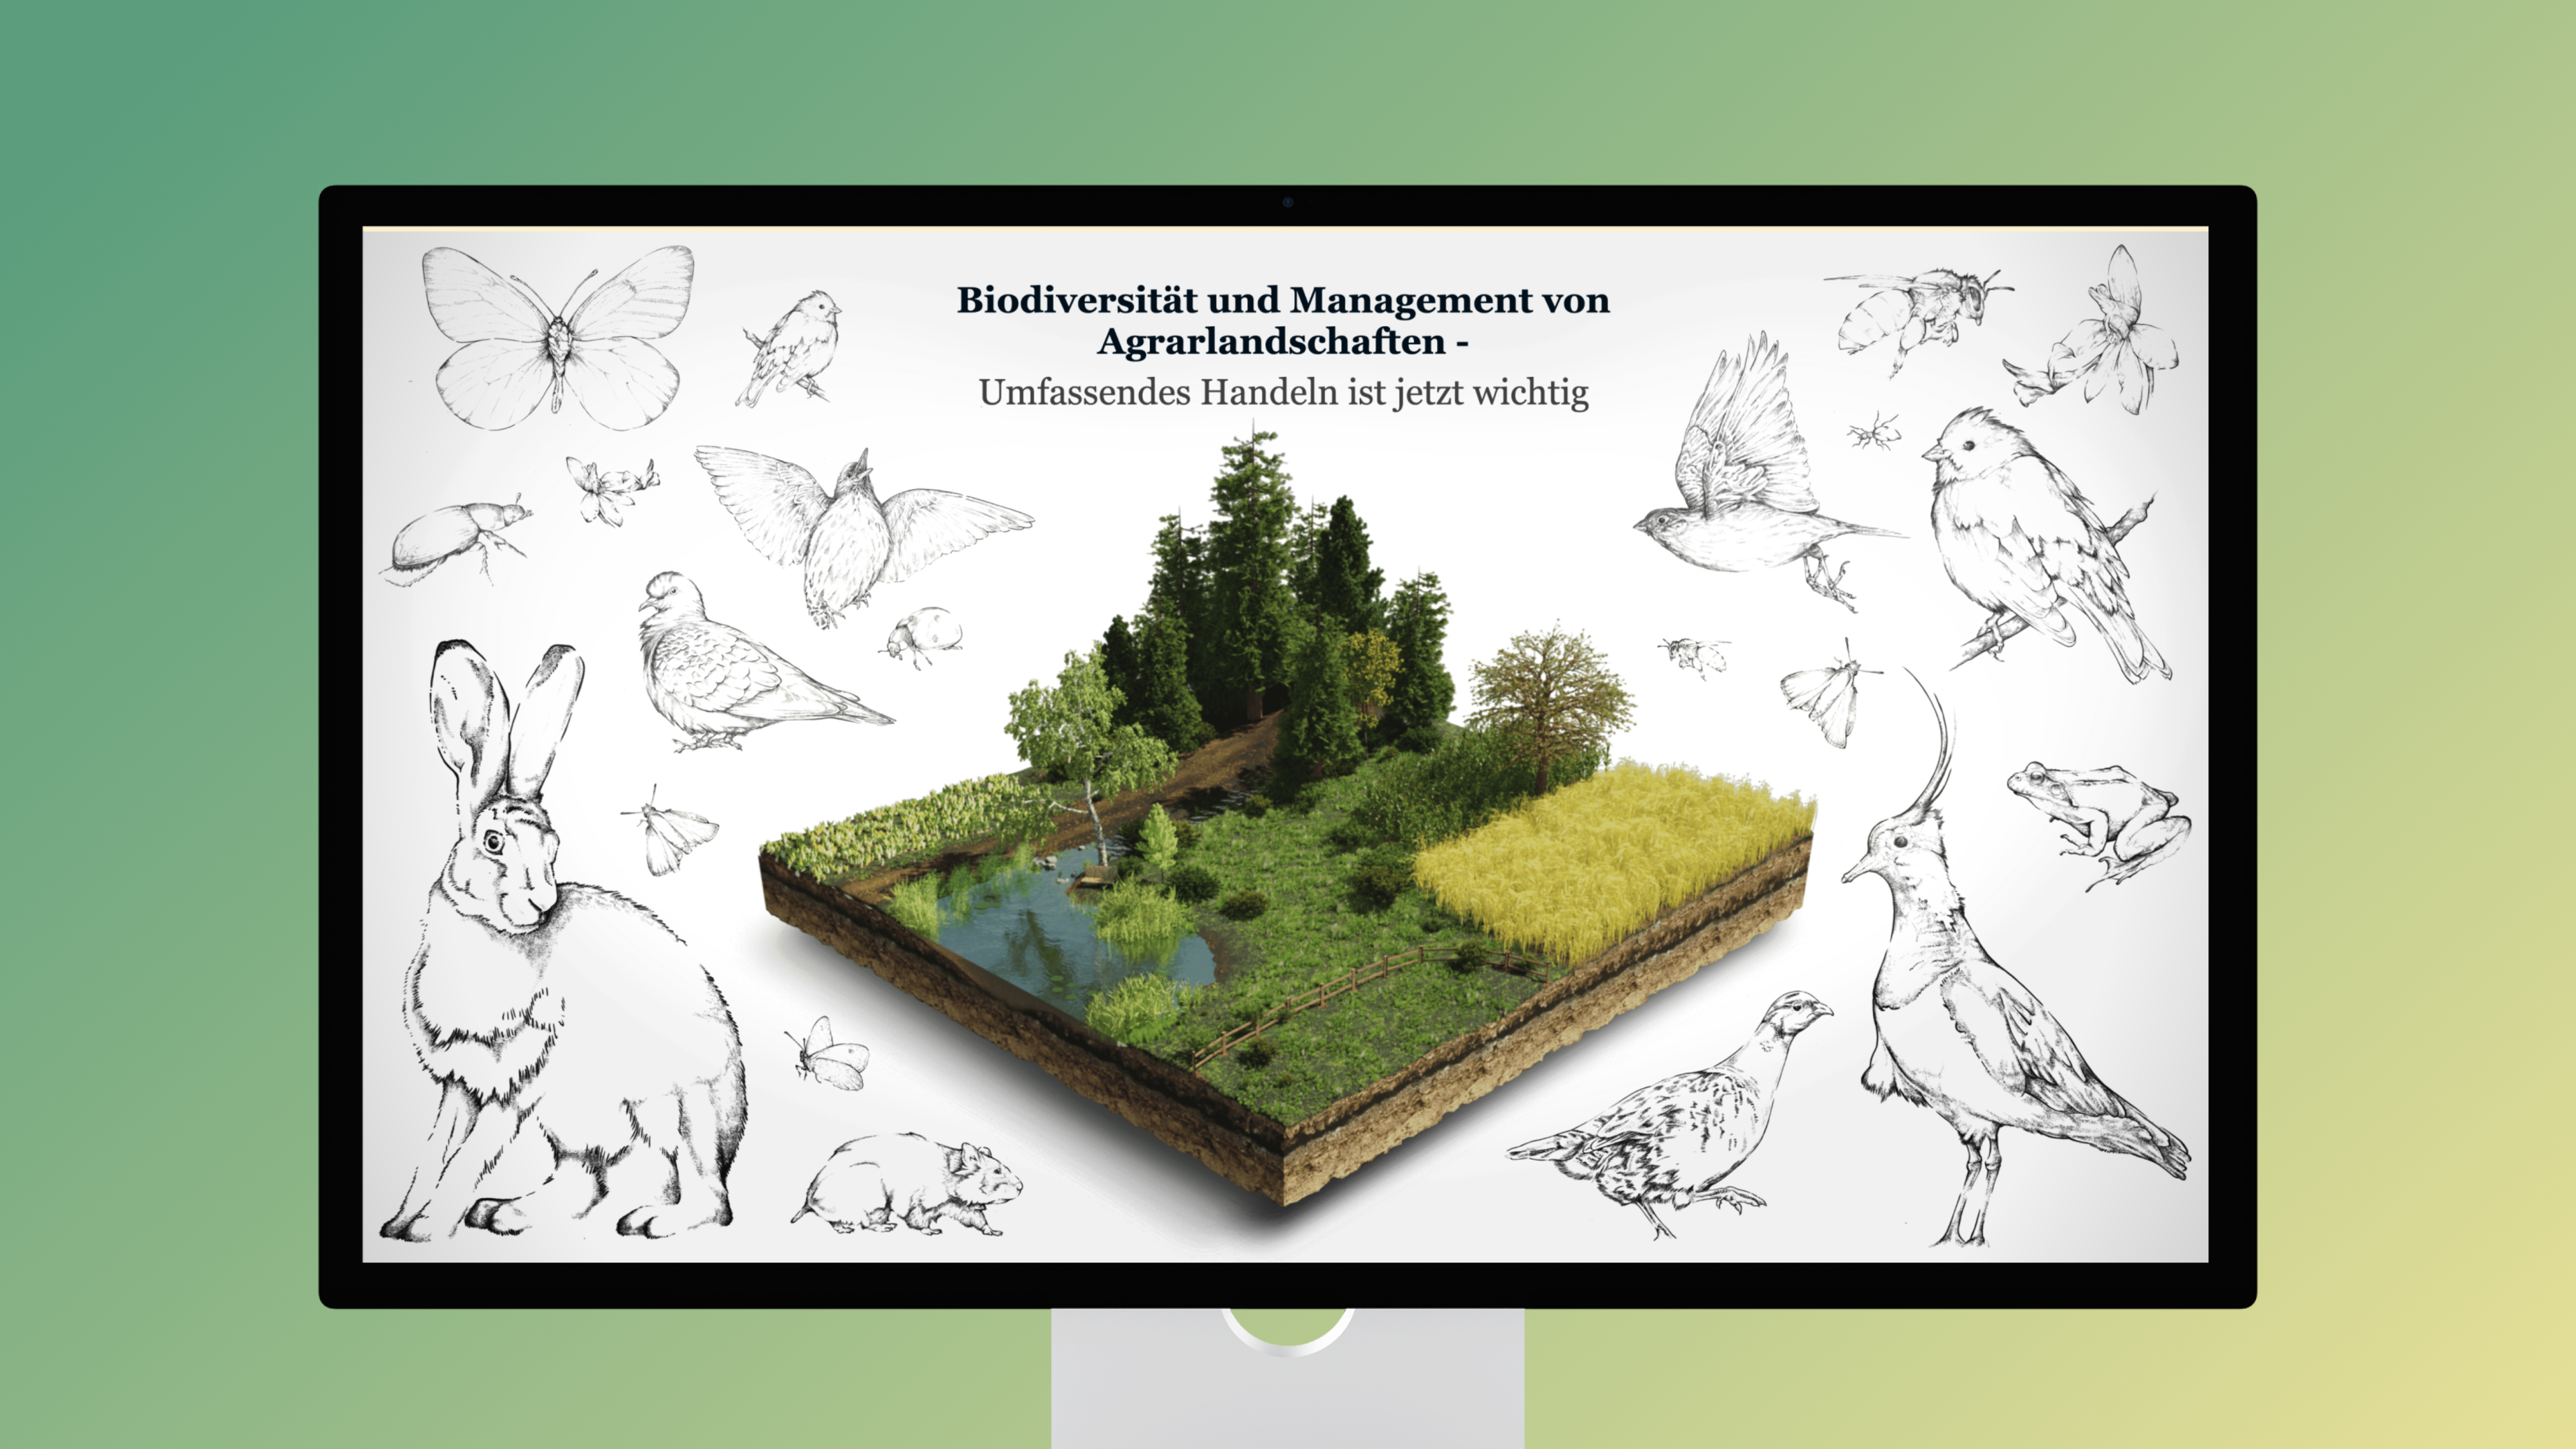
Biodiversity and Agricultural Management
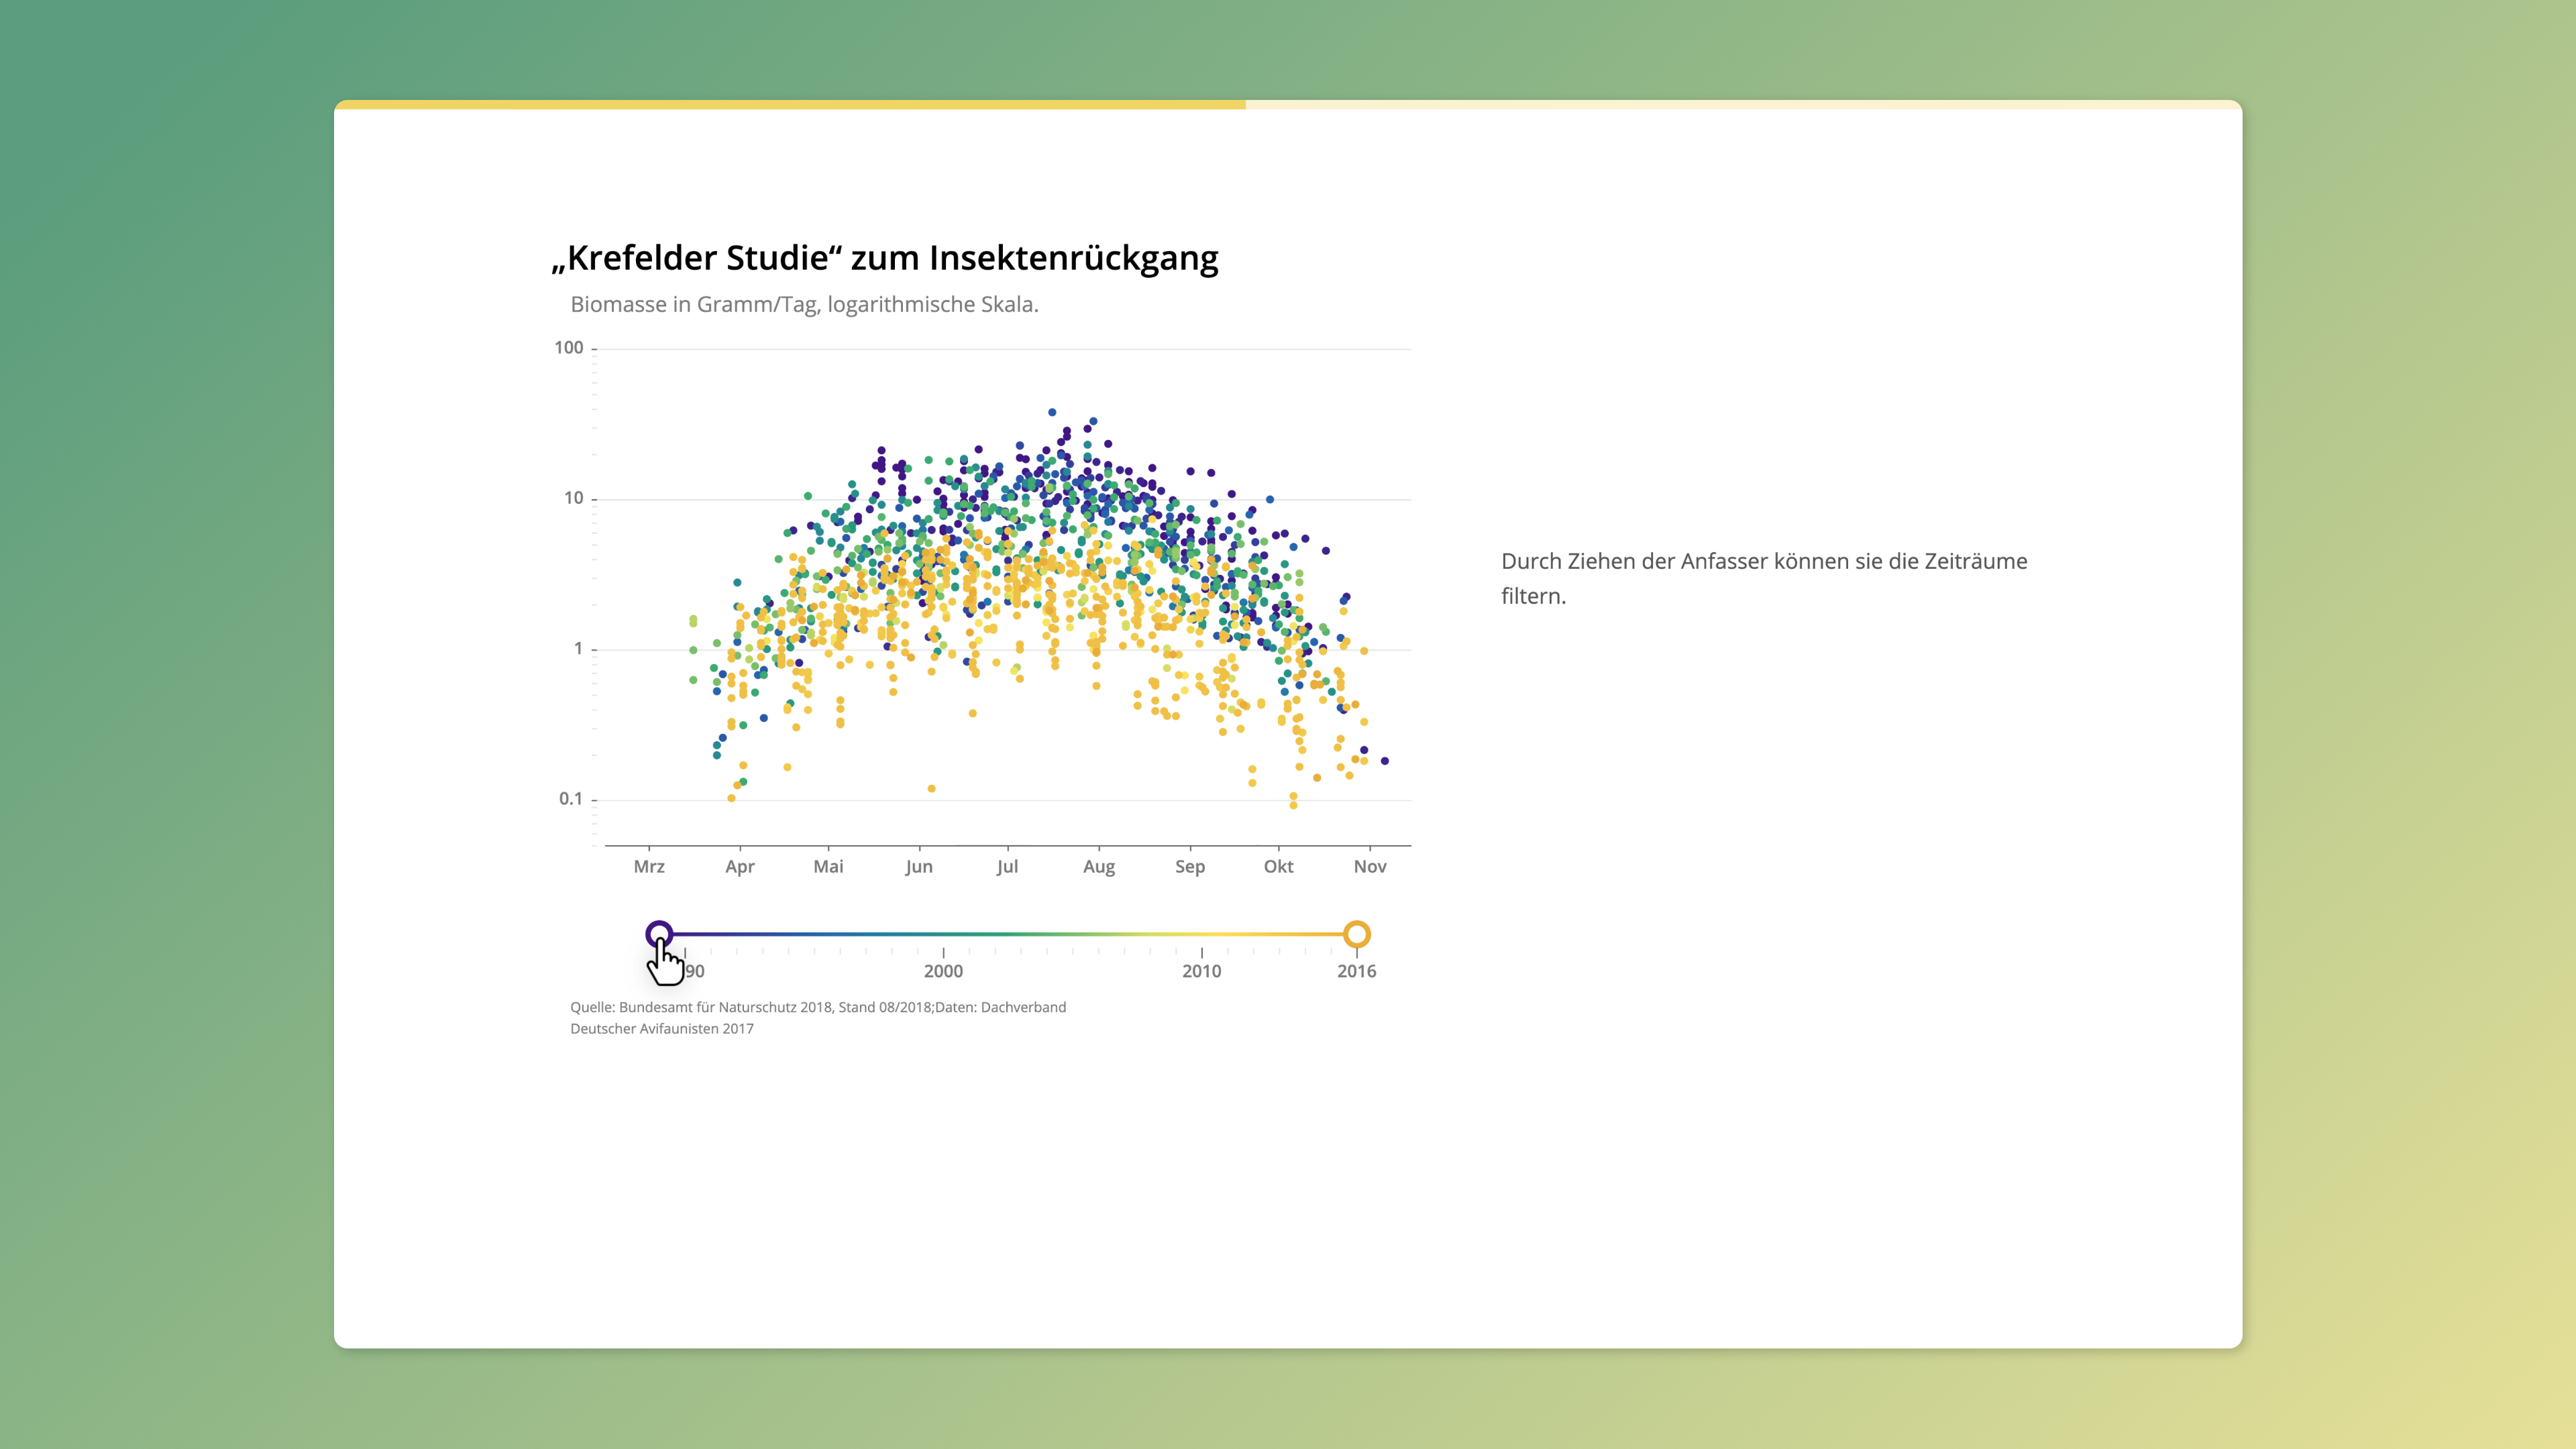
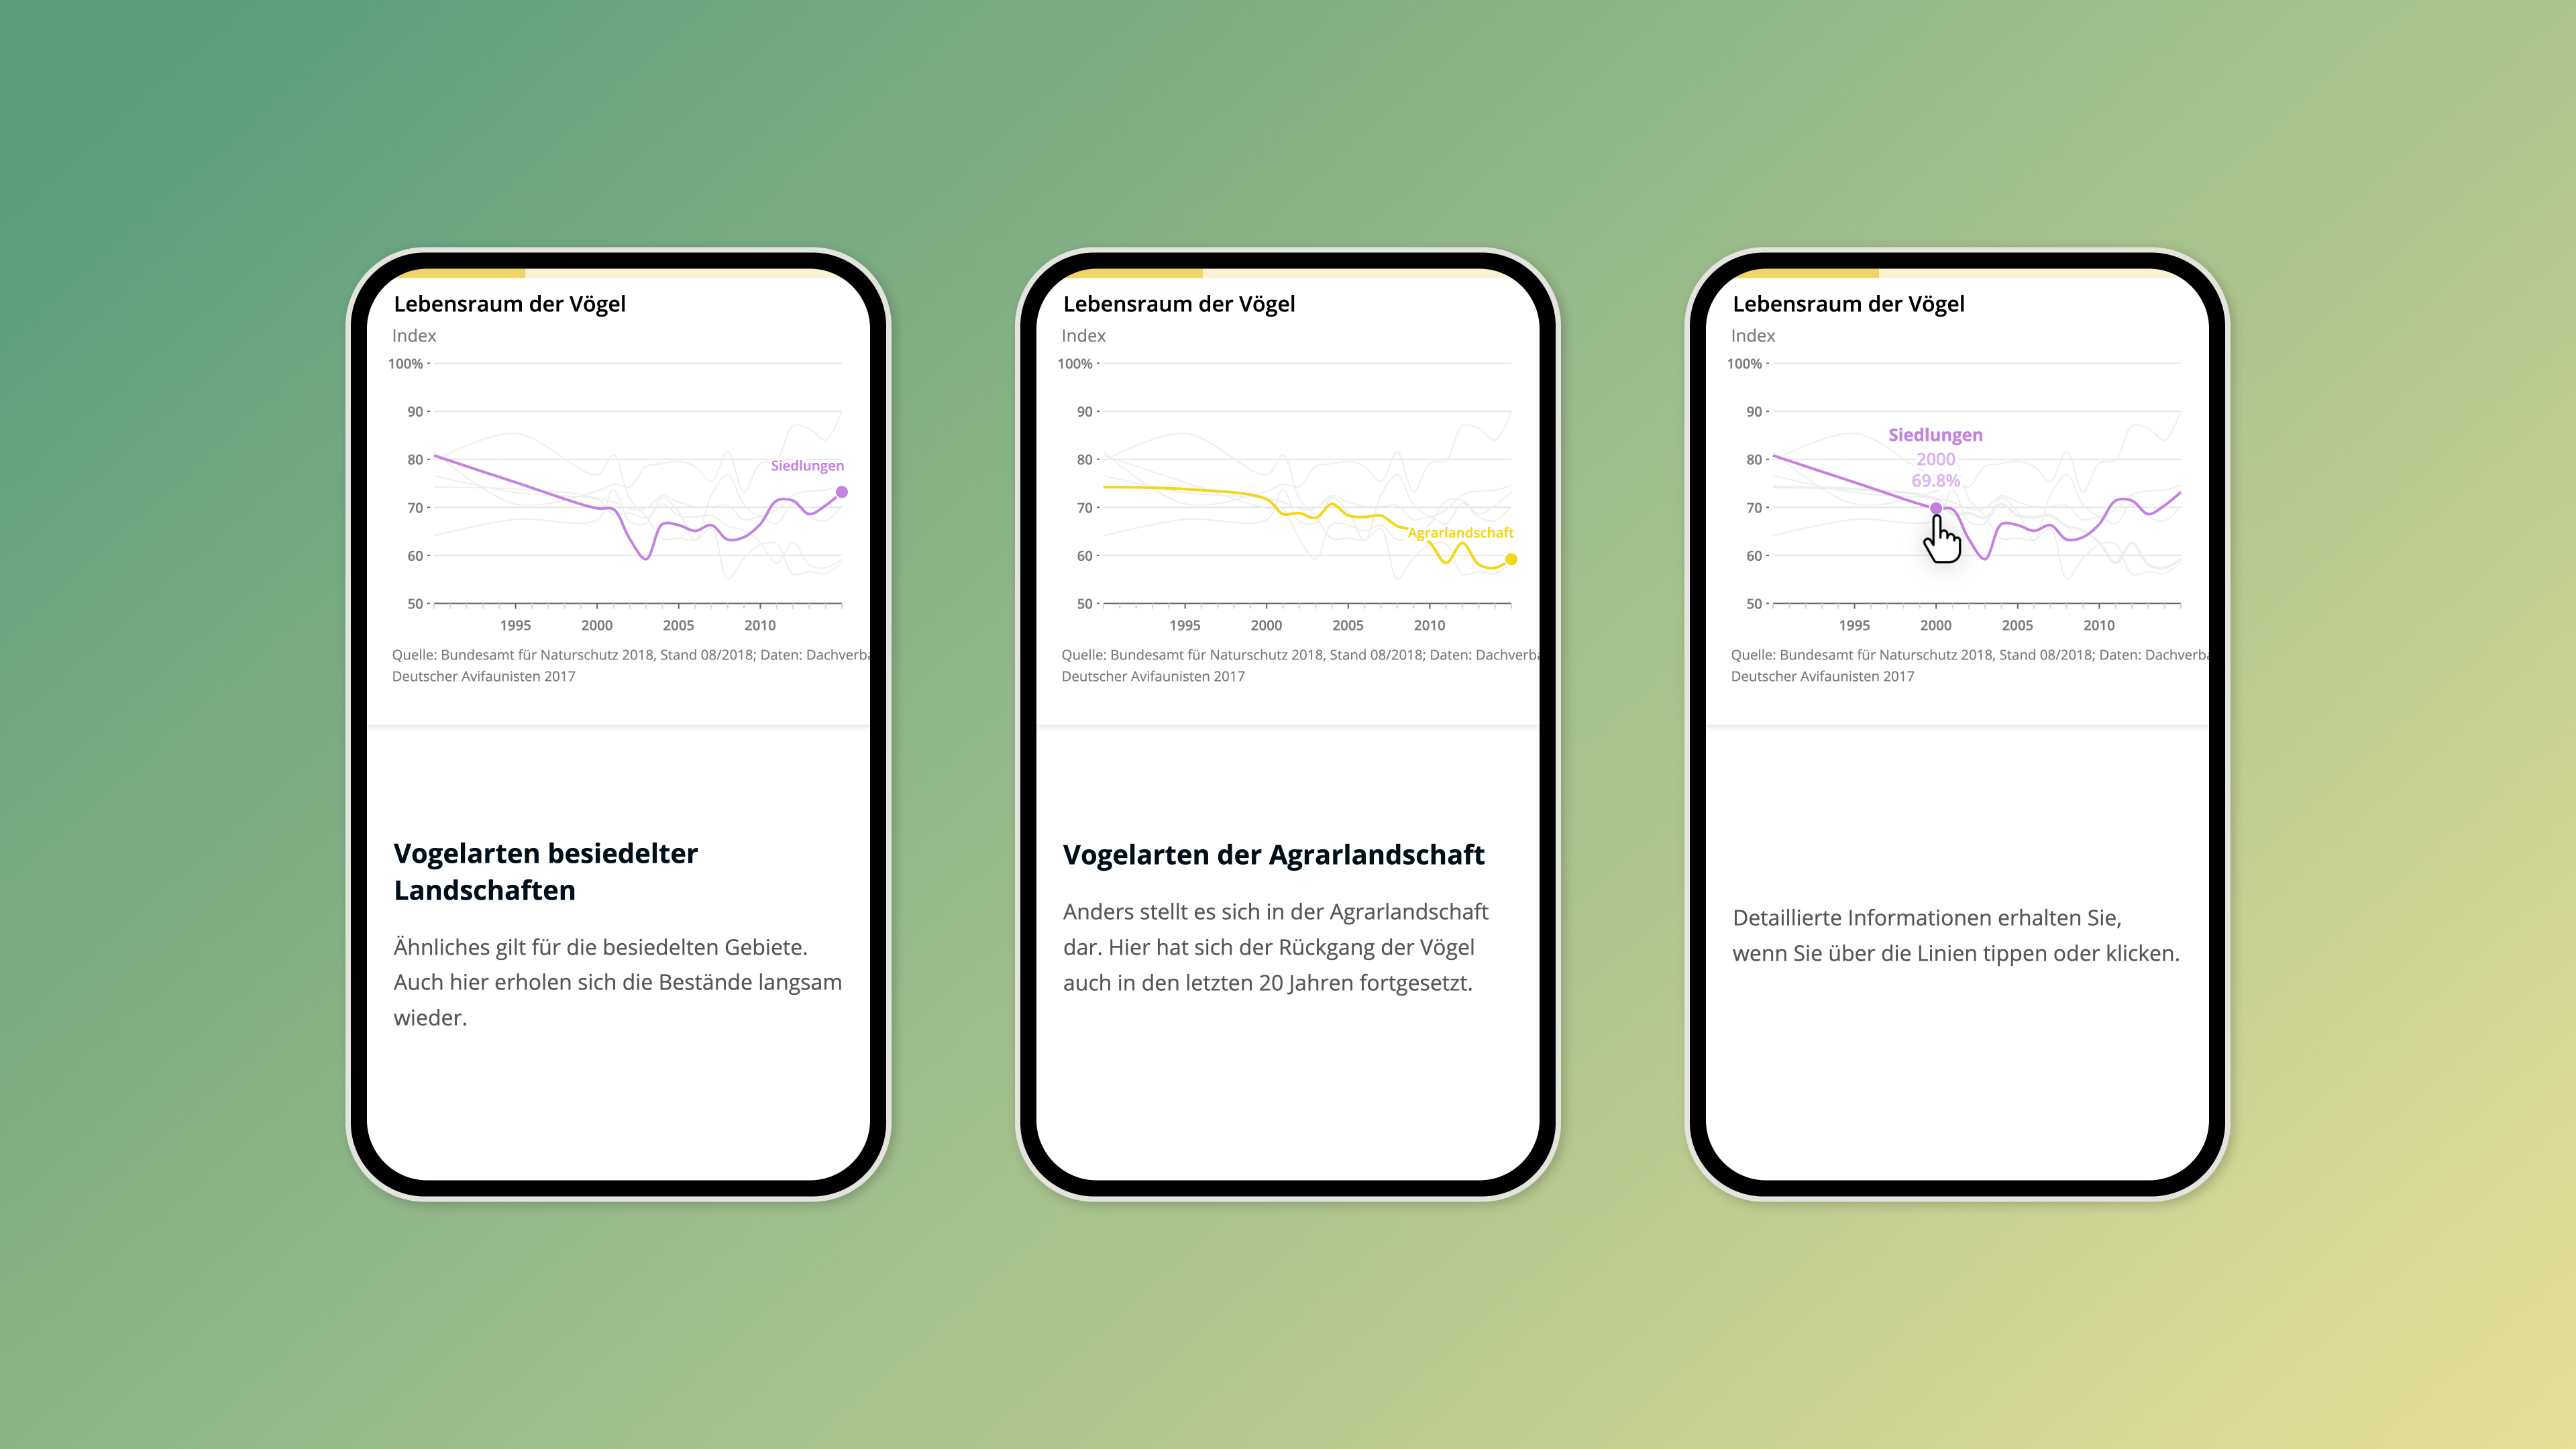
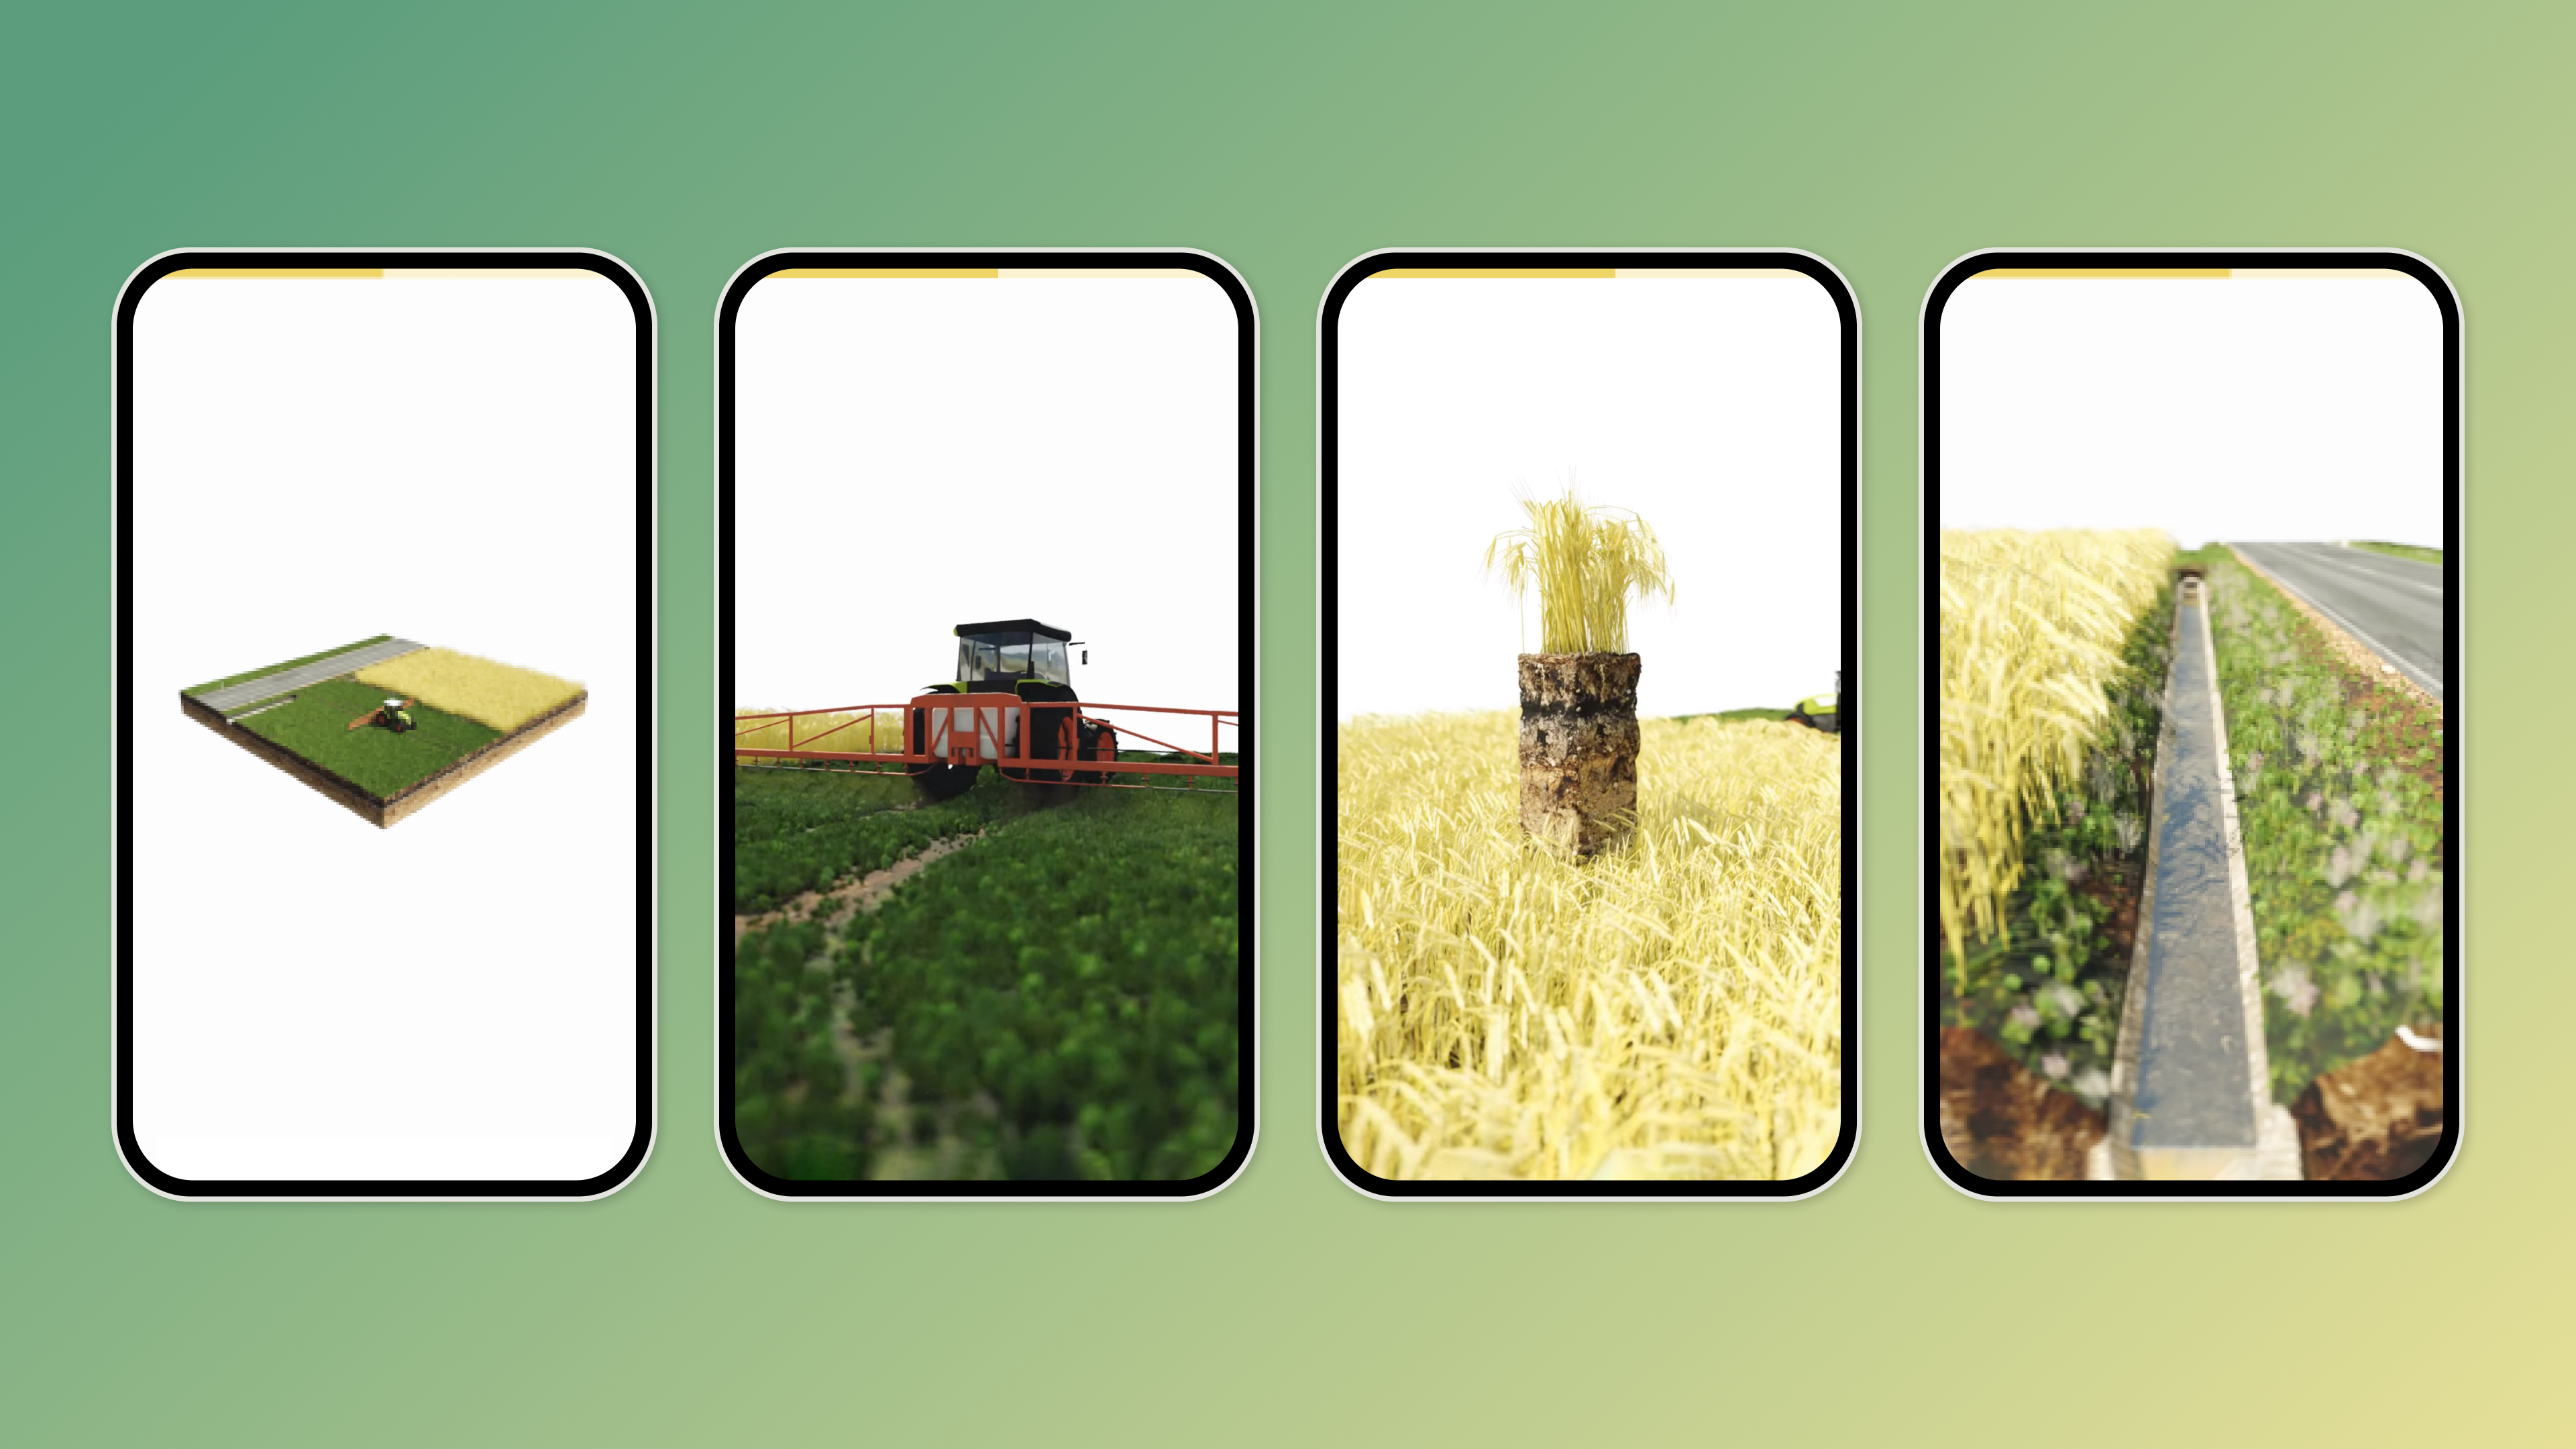
This project, realized in collaboration with multiple scientific organizations, is based on a study examining the causes of biodiversity decline. To present the findings to a broad audience in an interesting manner, we conceived and implemented an interactive storytelling experience.
Project features:
- Interactive App
- Science
- Data Storytelling
- Clients: Leopoldina, Acatech, Akademieunion
- Services: Illustration, Animation, Data Visualization, Web Development
- Award: Information is Beautiful Shortlist
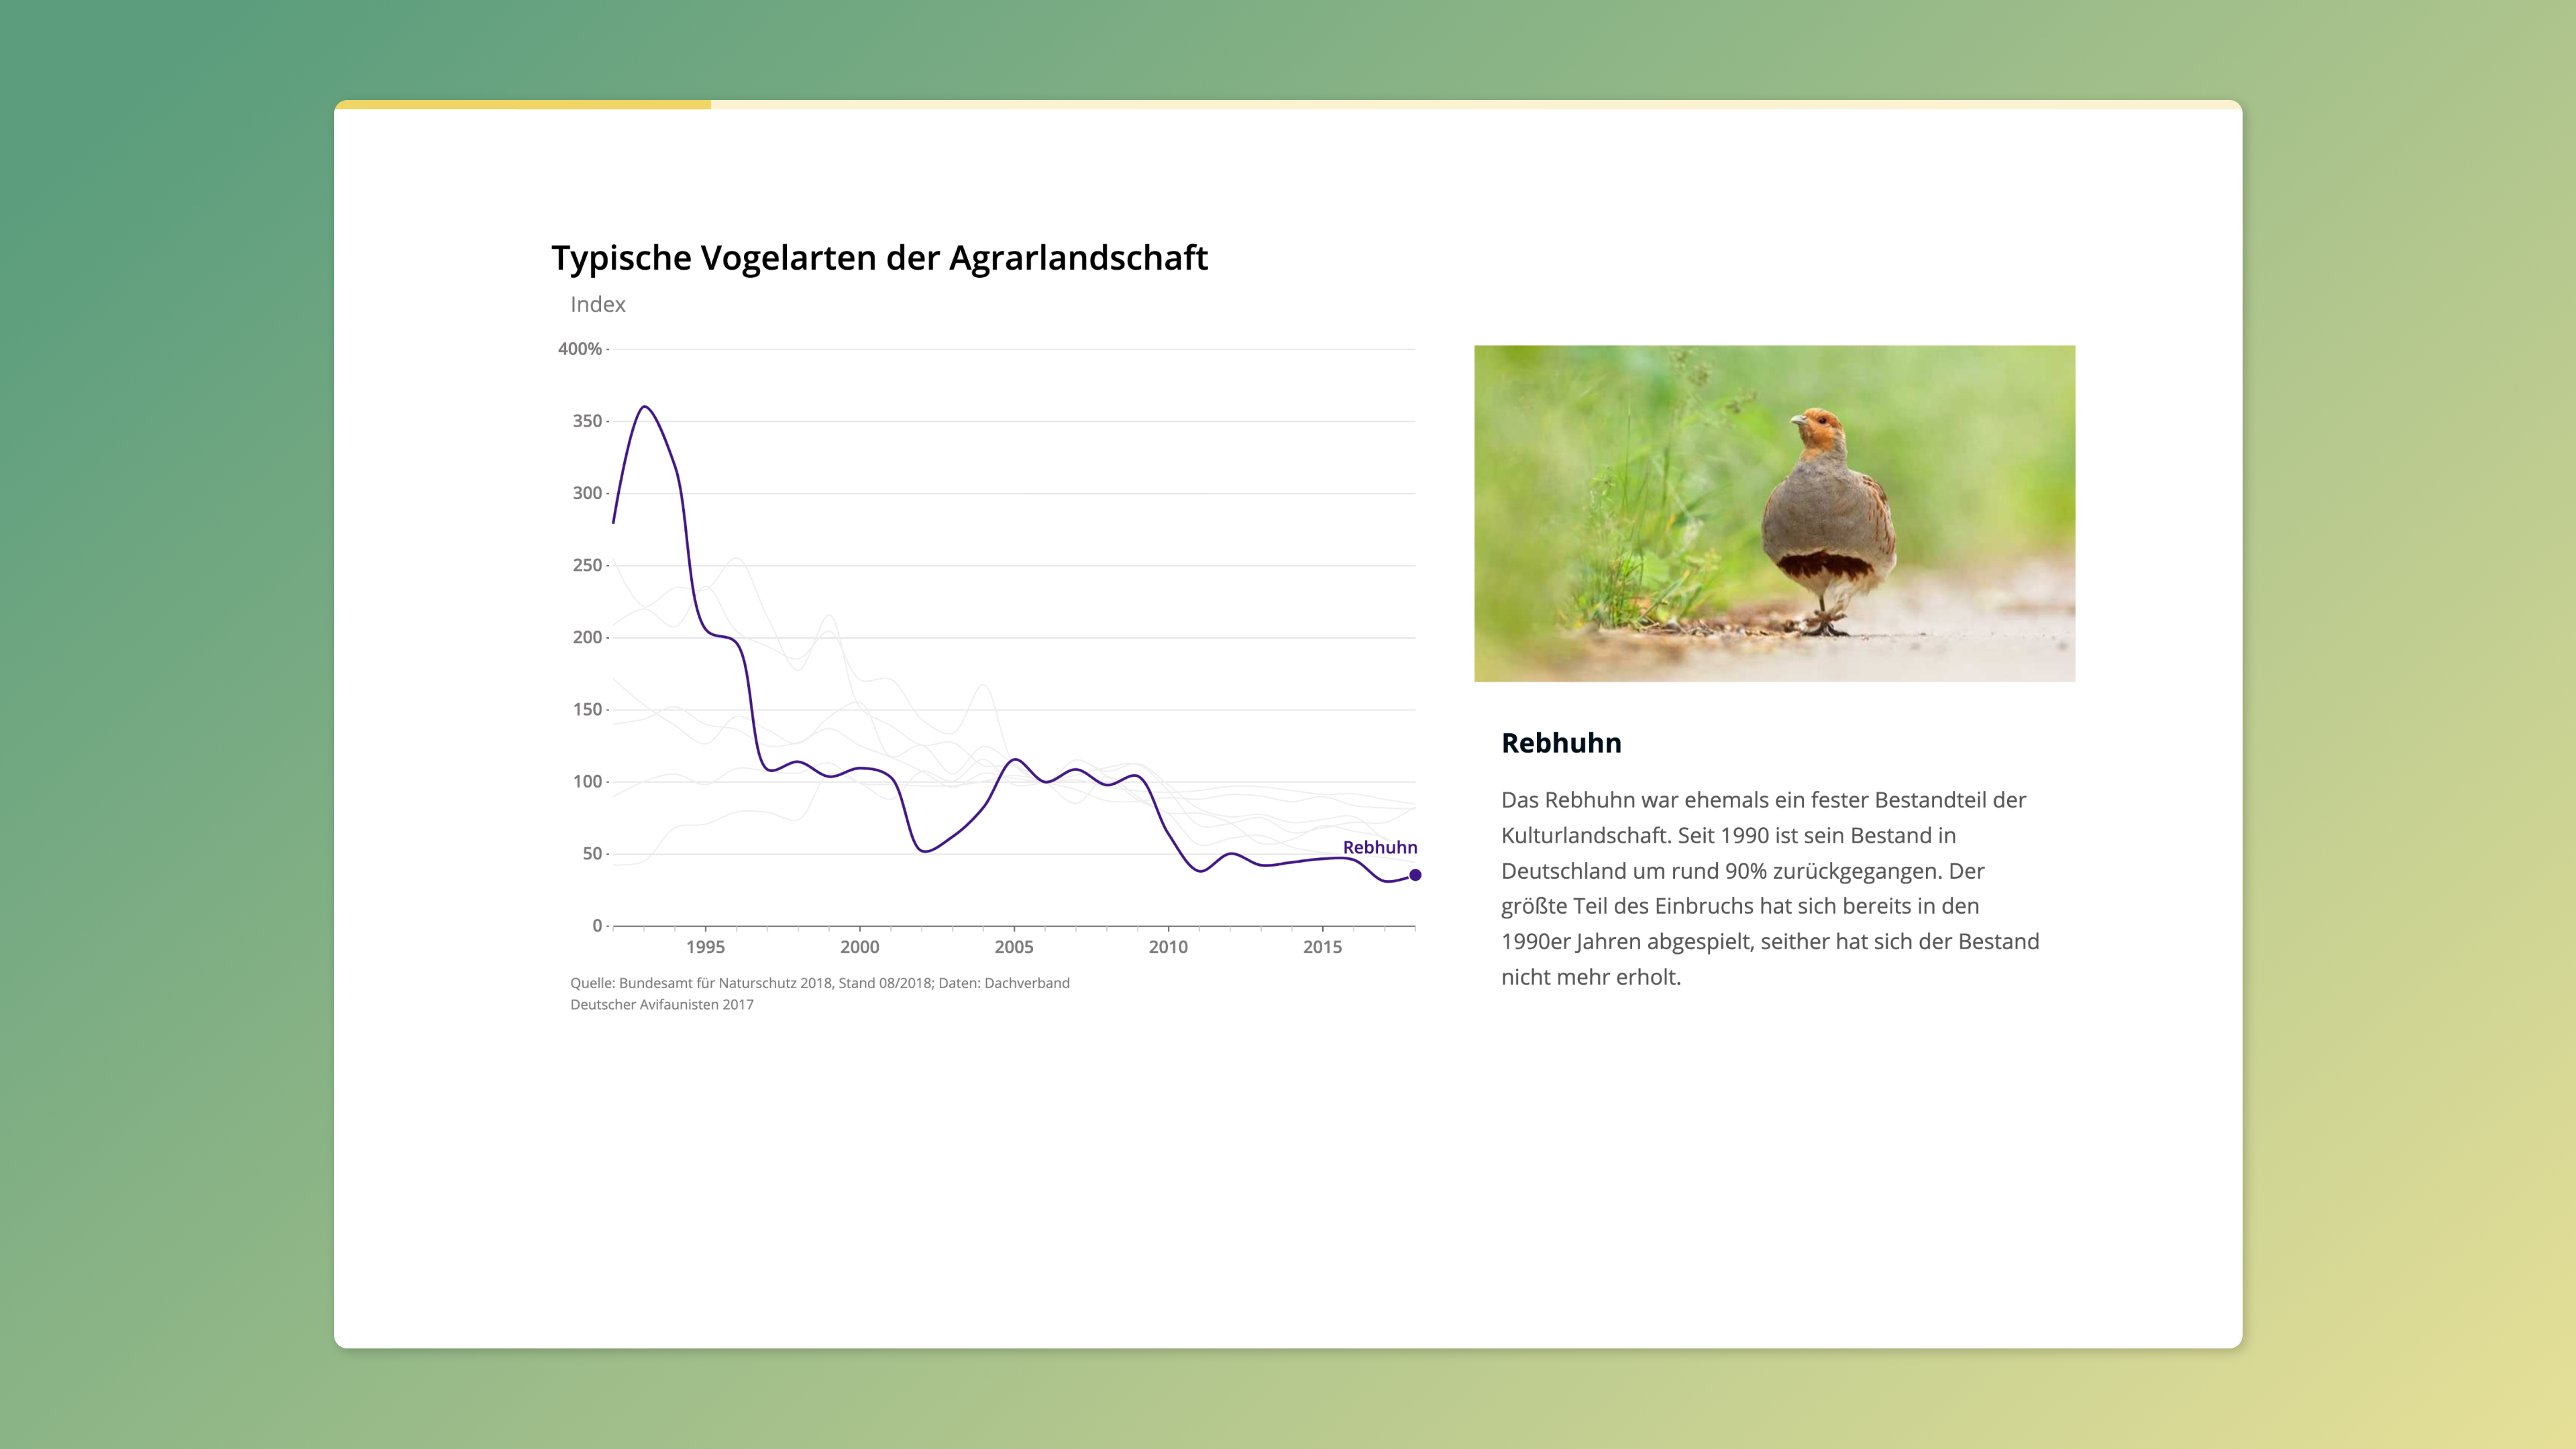
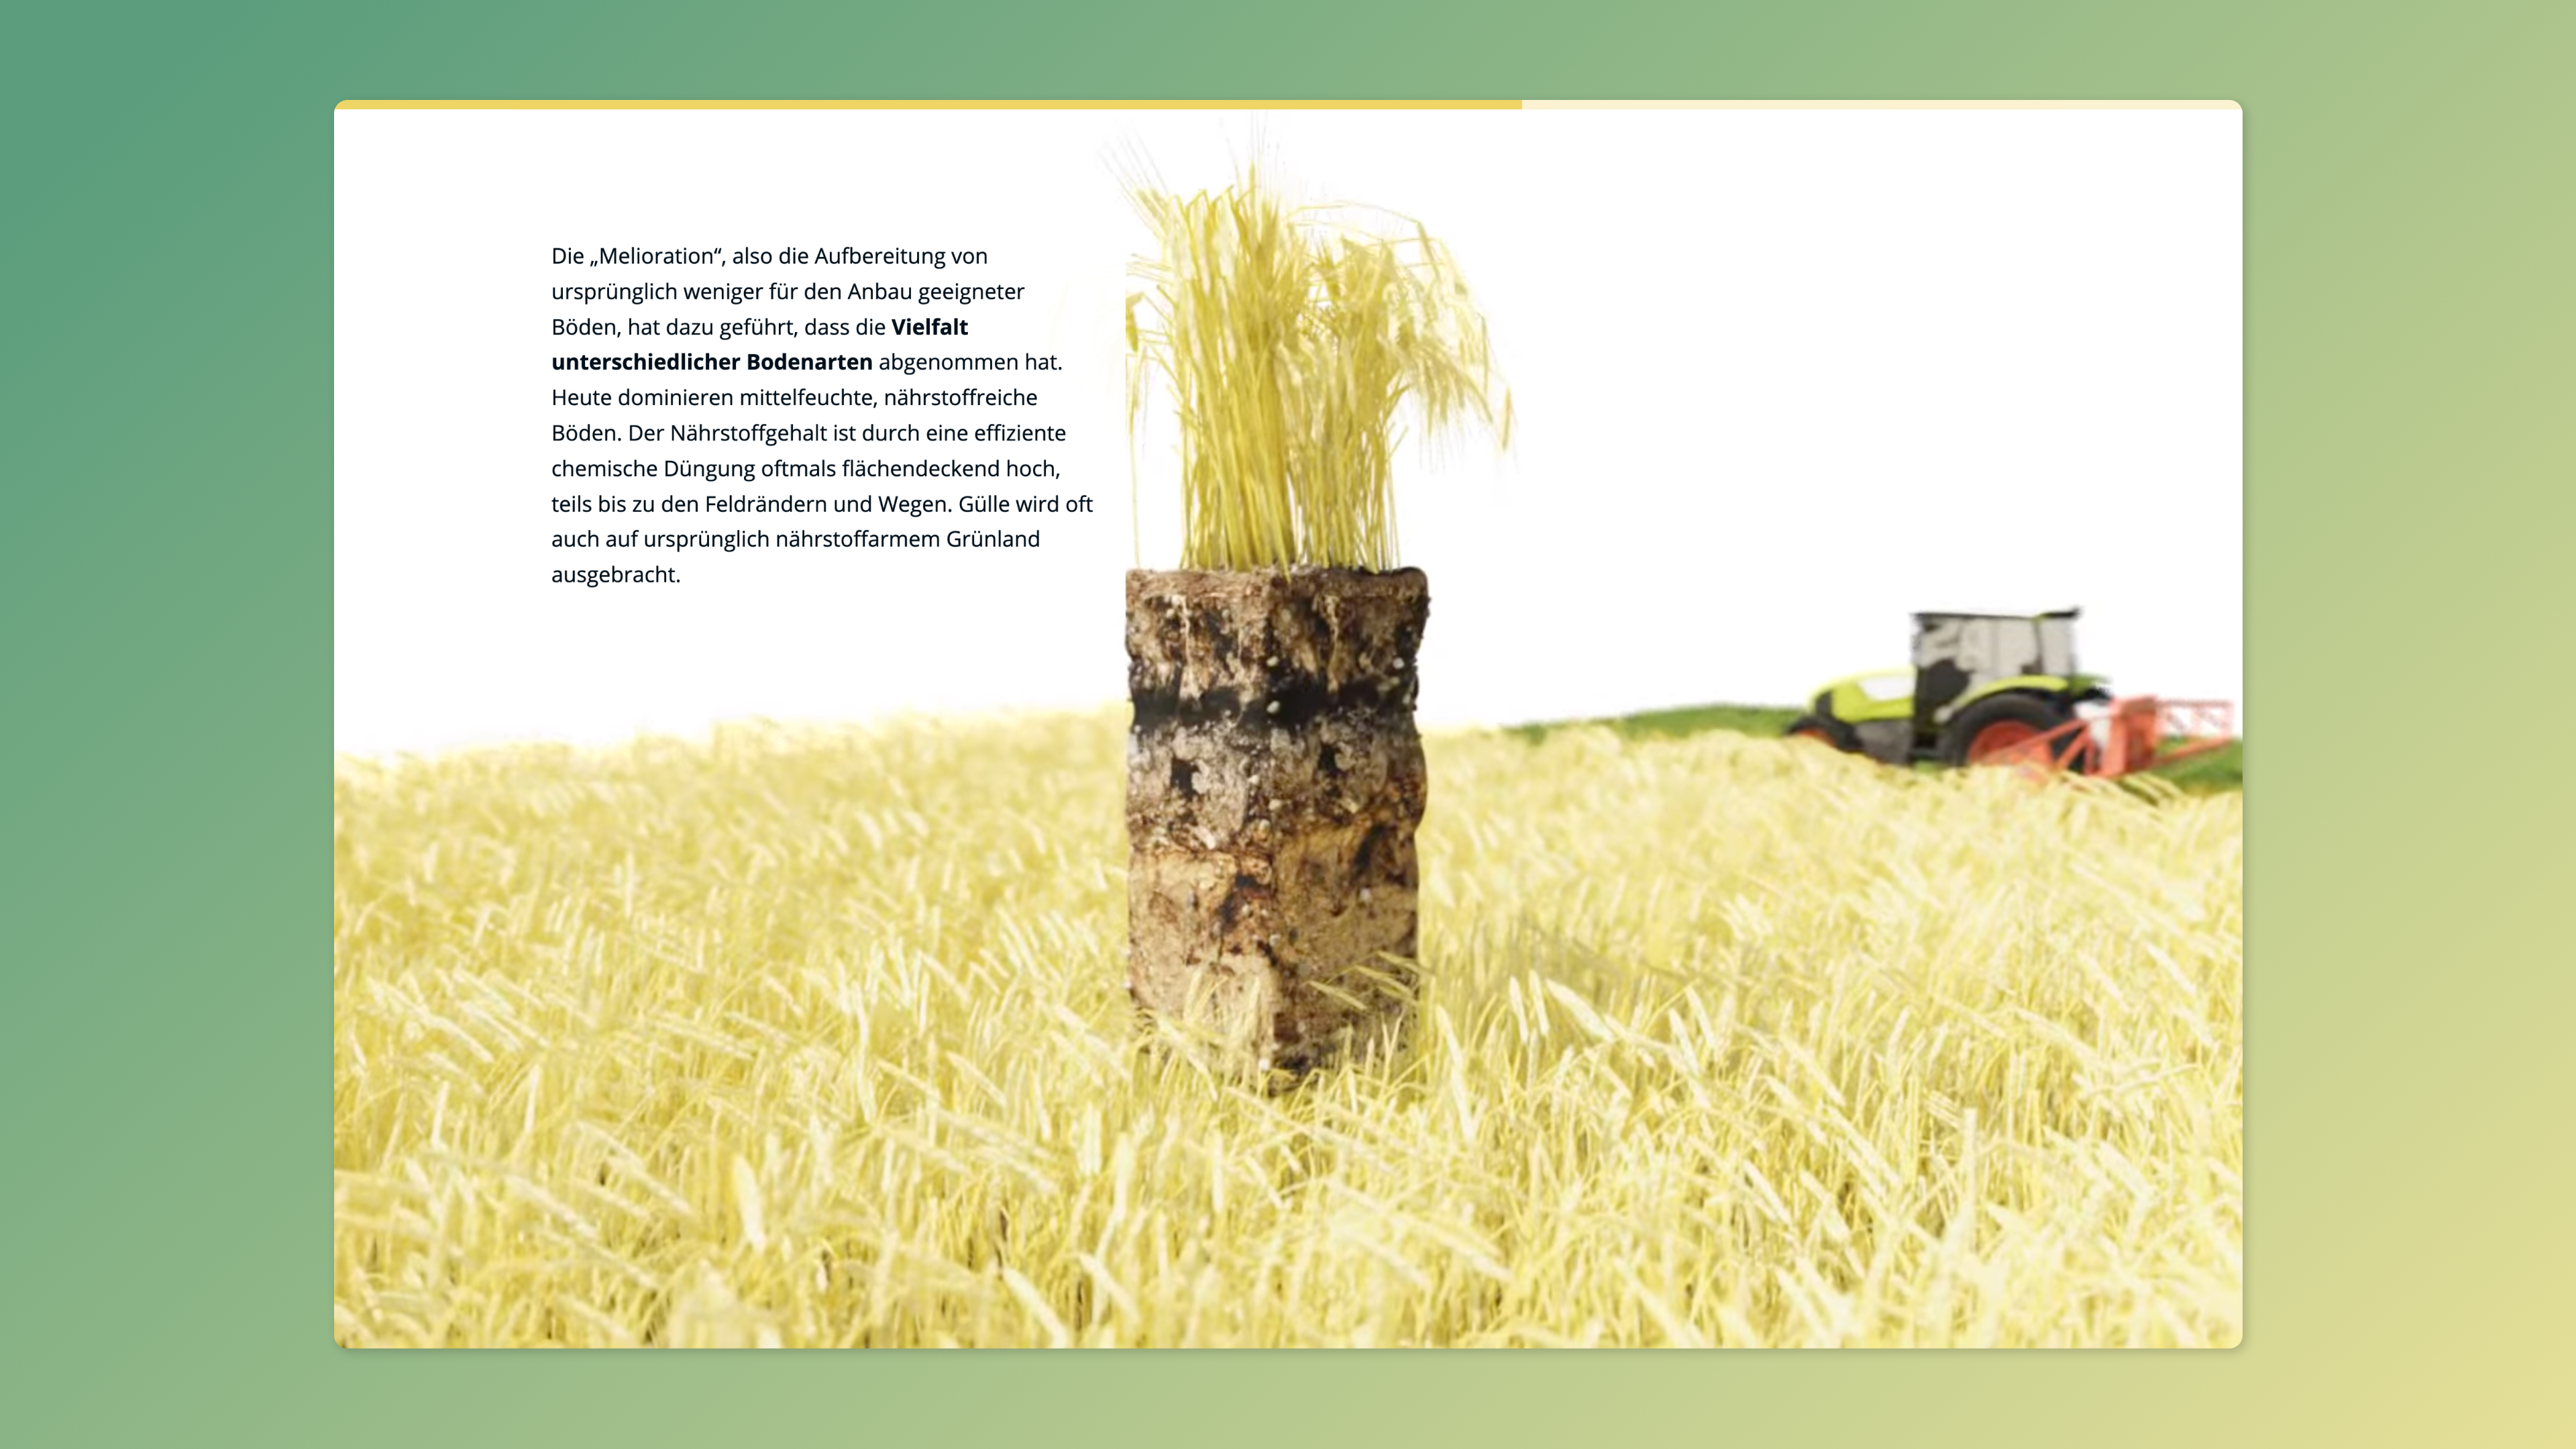
Key elements of the microsite include interactive data visualizations and animated 3D landscapes that we modeled and animated ourselves. Additionally, we present a catalog of suggested actions that users can sort by categories.